real machines, not mockups

Showcase

Screenshots of hqtui-demo running on real machines — a laptop and a server, reading their own metrics. Nothing here is a mockup, and nothing is staged.

Dashboard

A laptop reading itself: per-core meters, real thermal sensors and voltage rails, live disk and network throughput, and the process table.
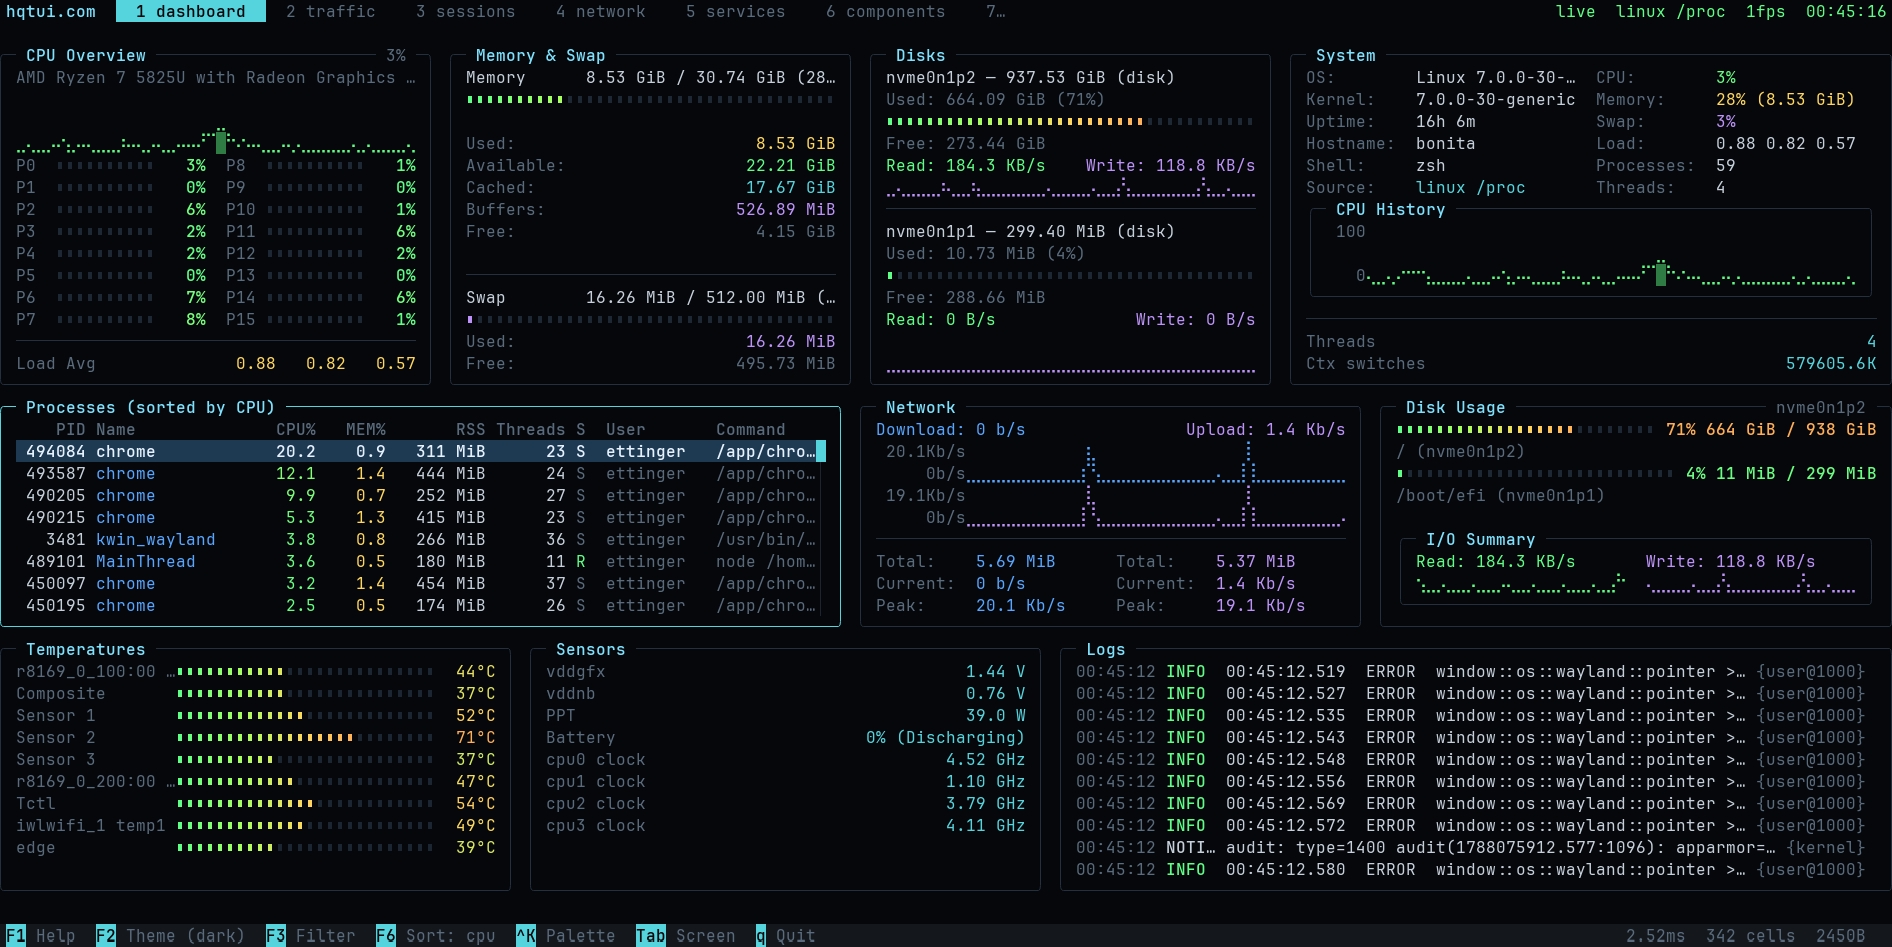
hqtui-demo — dashboard
HQTUI dashboard

Real-time telemetry

Well past CPU and memory. Every screen below is reading a real machine — the login origins in Sessions are masked, nothing else is touched.
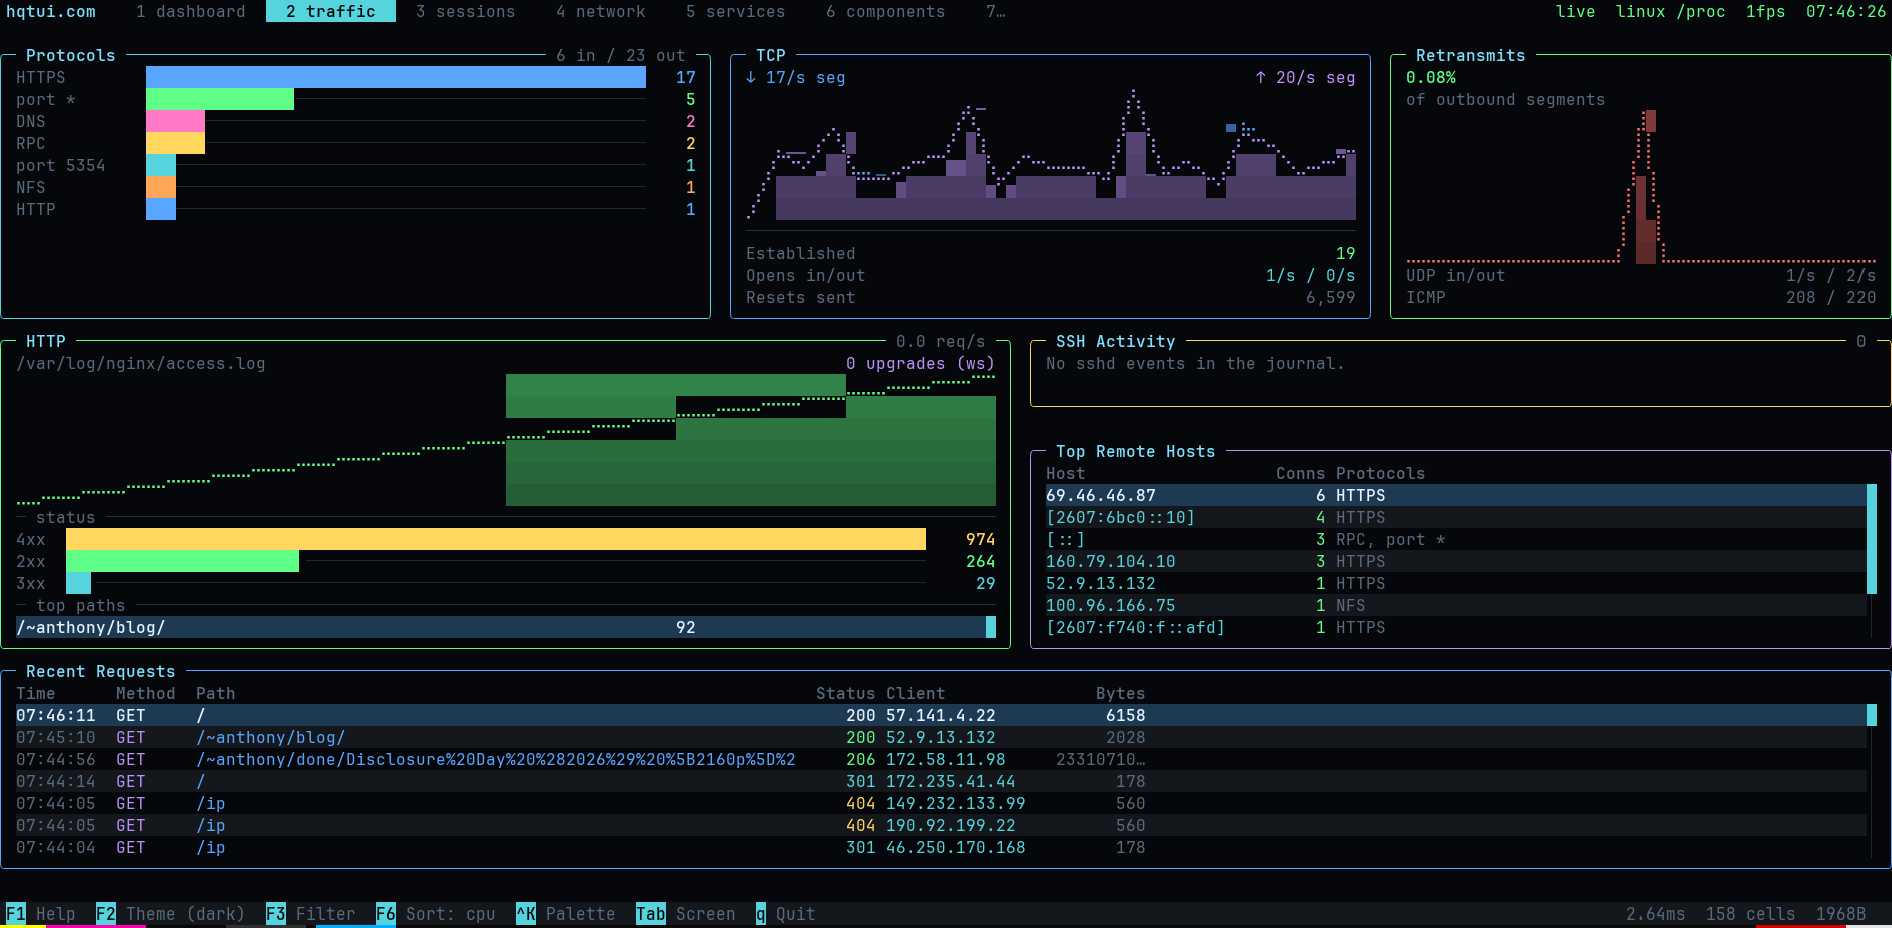
traffic
HQTUI Traffic screen
TrafficEvery protocol in and out of the host: socket breakdown, TCP counters with retransmit rate, live HTTP request tracking from access logs, and sshd auth events.
network
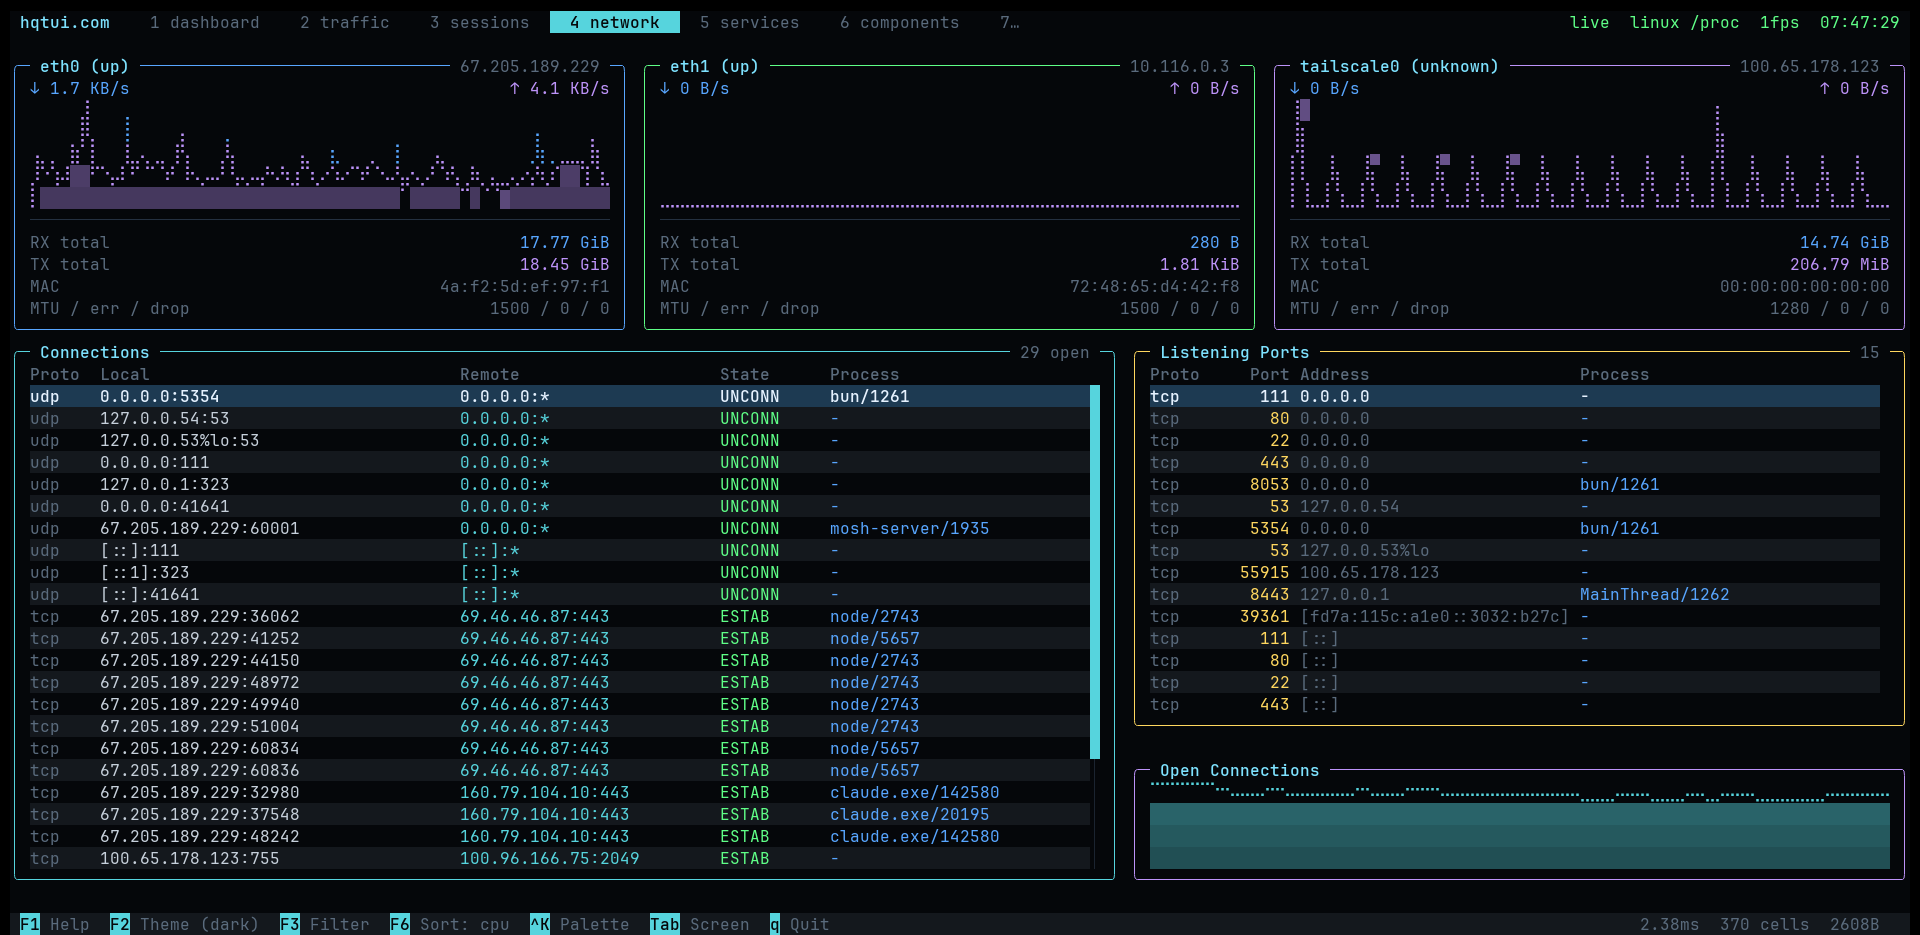
HQTUI Network screen
NetworkPer-interface throughput graphs with totals and error counts, open connections with owning processes, and every listening port.
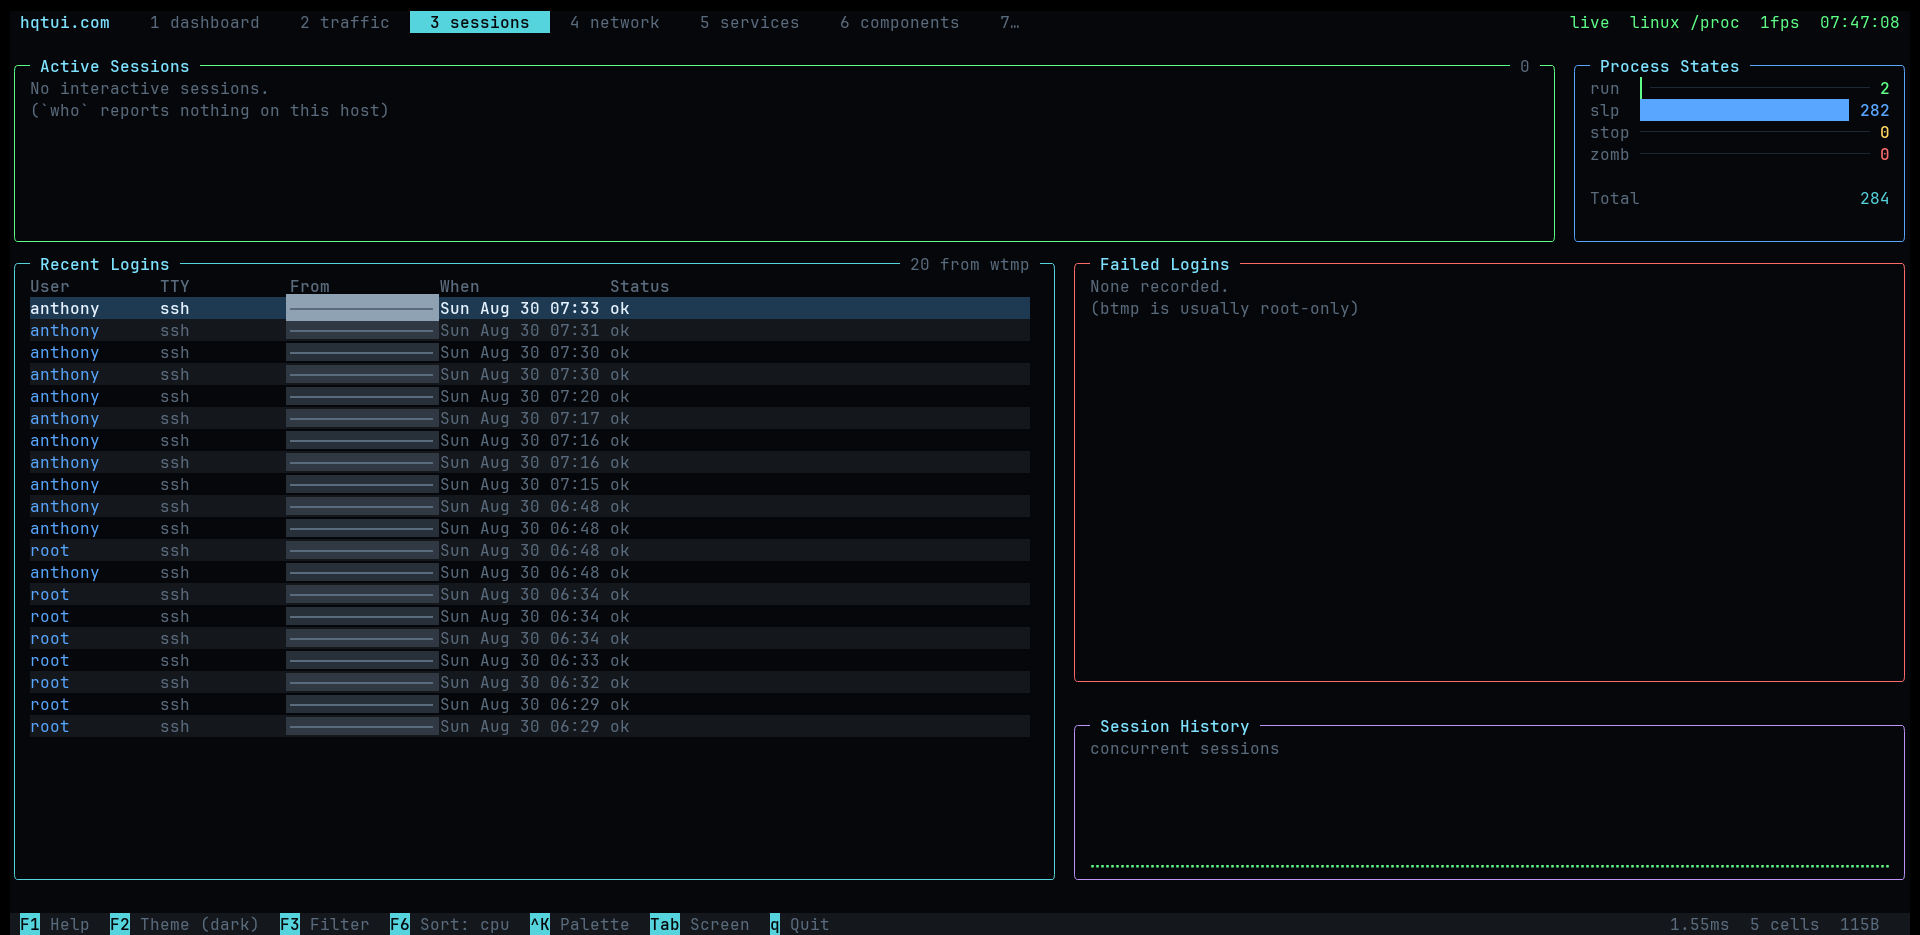
sessions
HQTUI Sessions screen
SessionsWho is logged in right now, login history from wtmp, failed attempts from btmp, and process state breakdown.
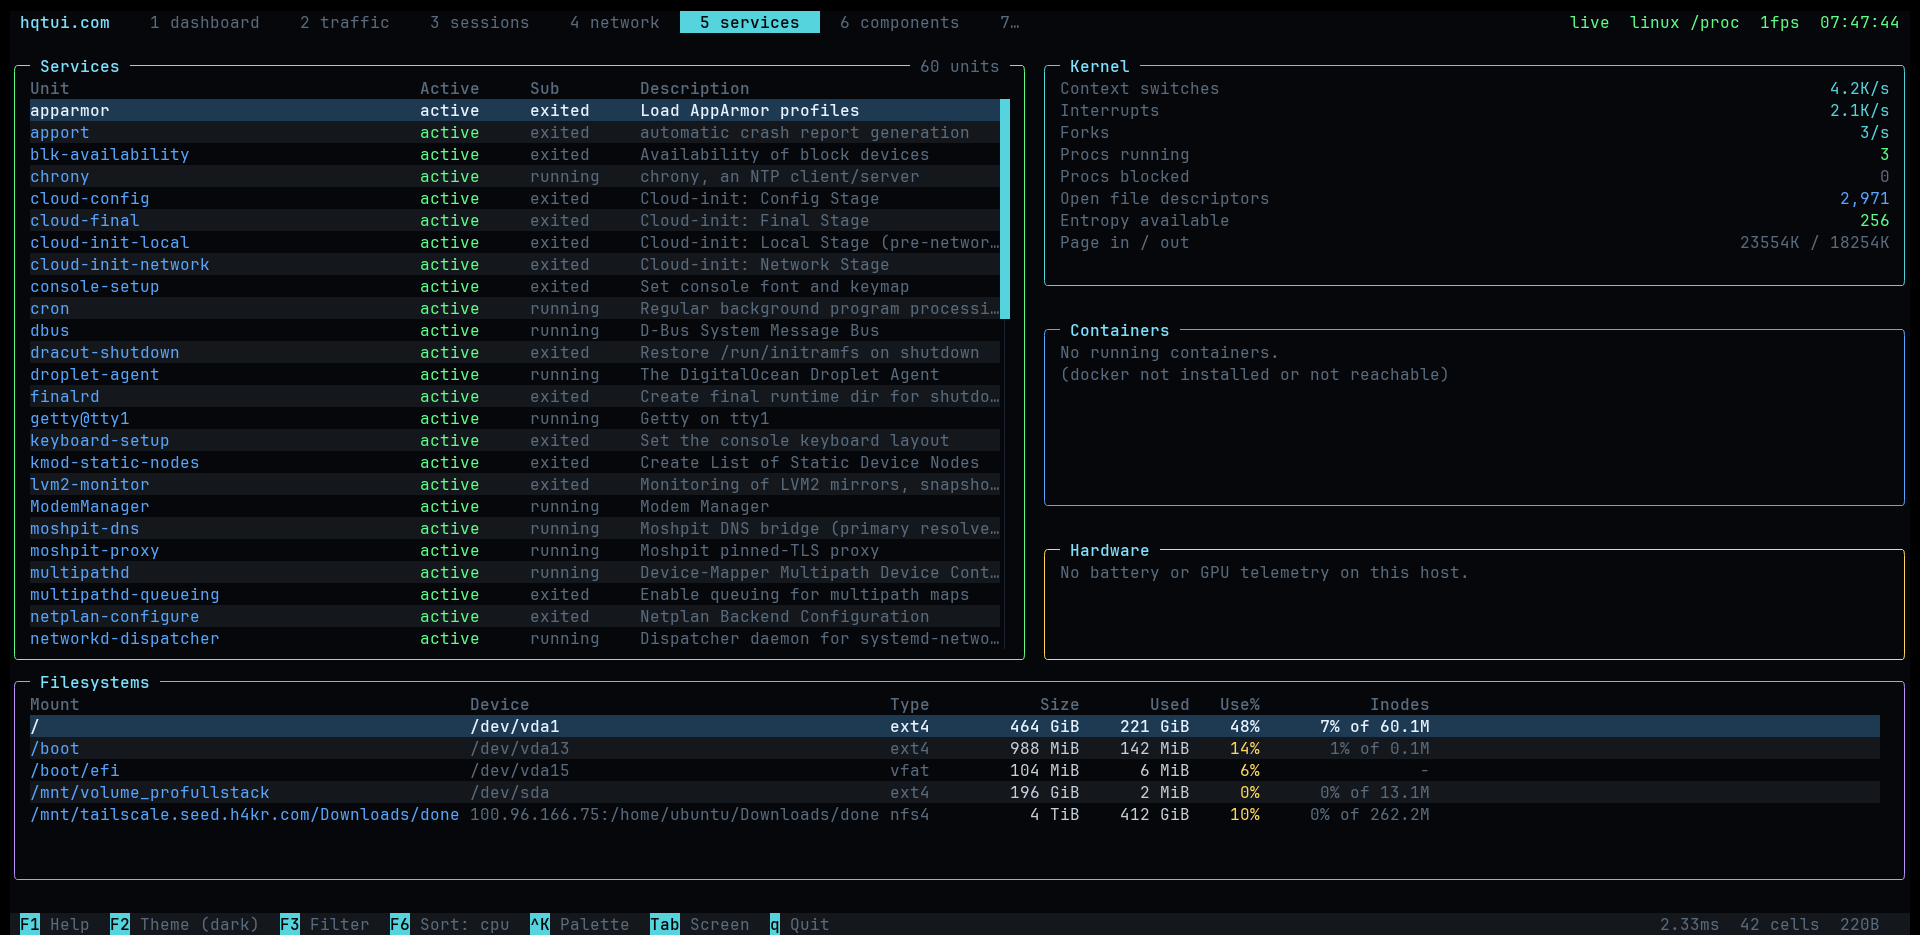
services
HQTUI Services screen
Servicessystemd units with failures first, containers, kernel counters, and filesystems with inode usage.

Widgets

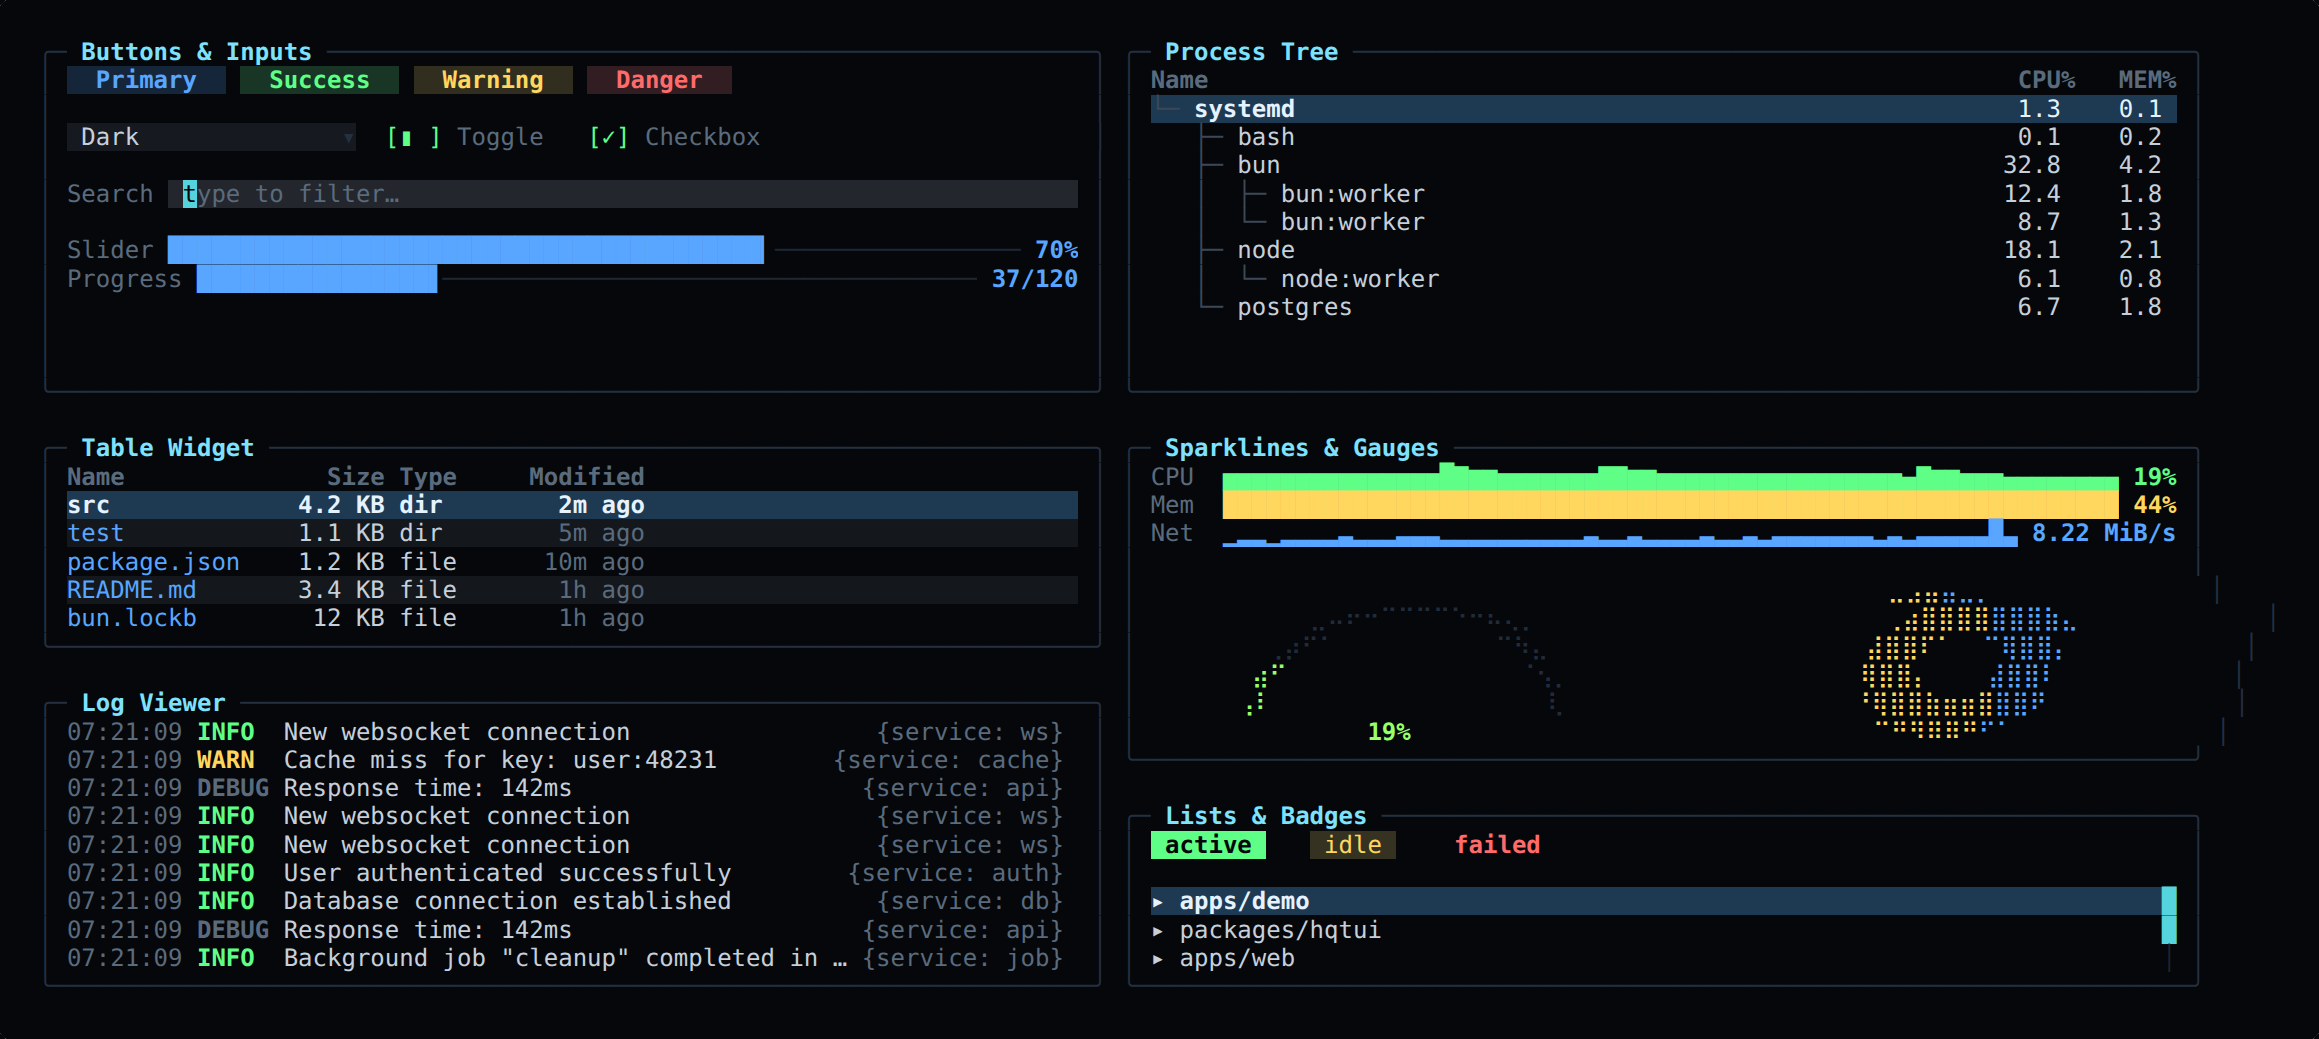
Meters, gauges, donuts, controls, a process tree, multi-series graphs, heat bars and a log viewer.
components
The HQTUI widget catalogue

Themes

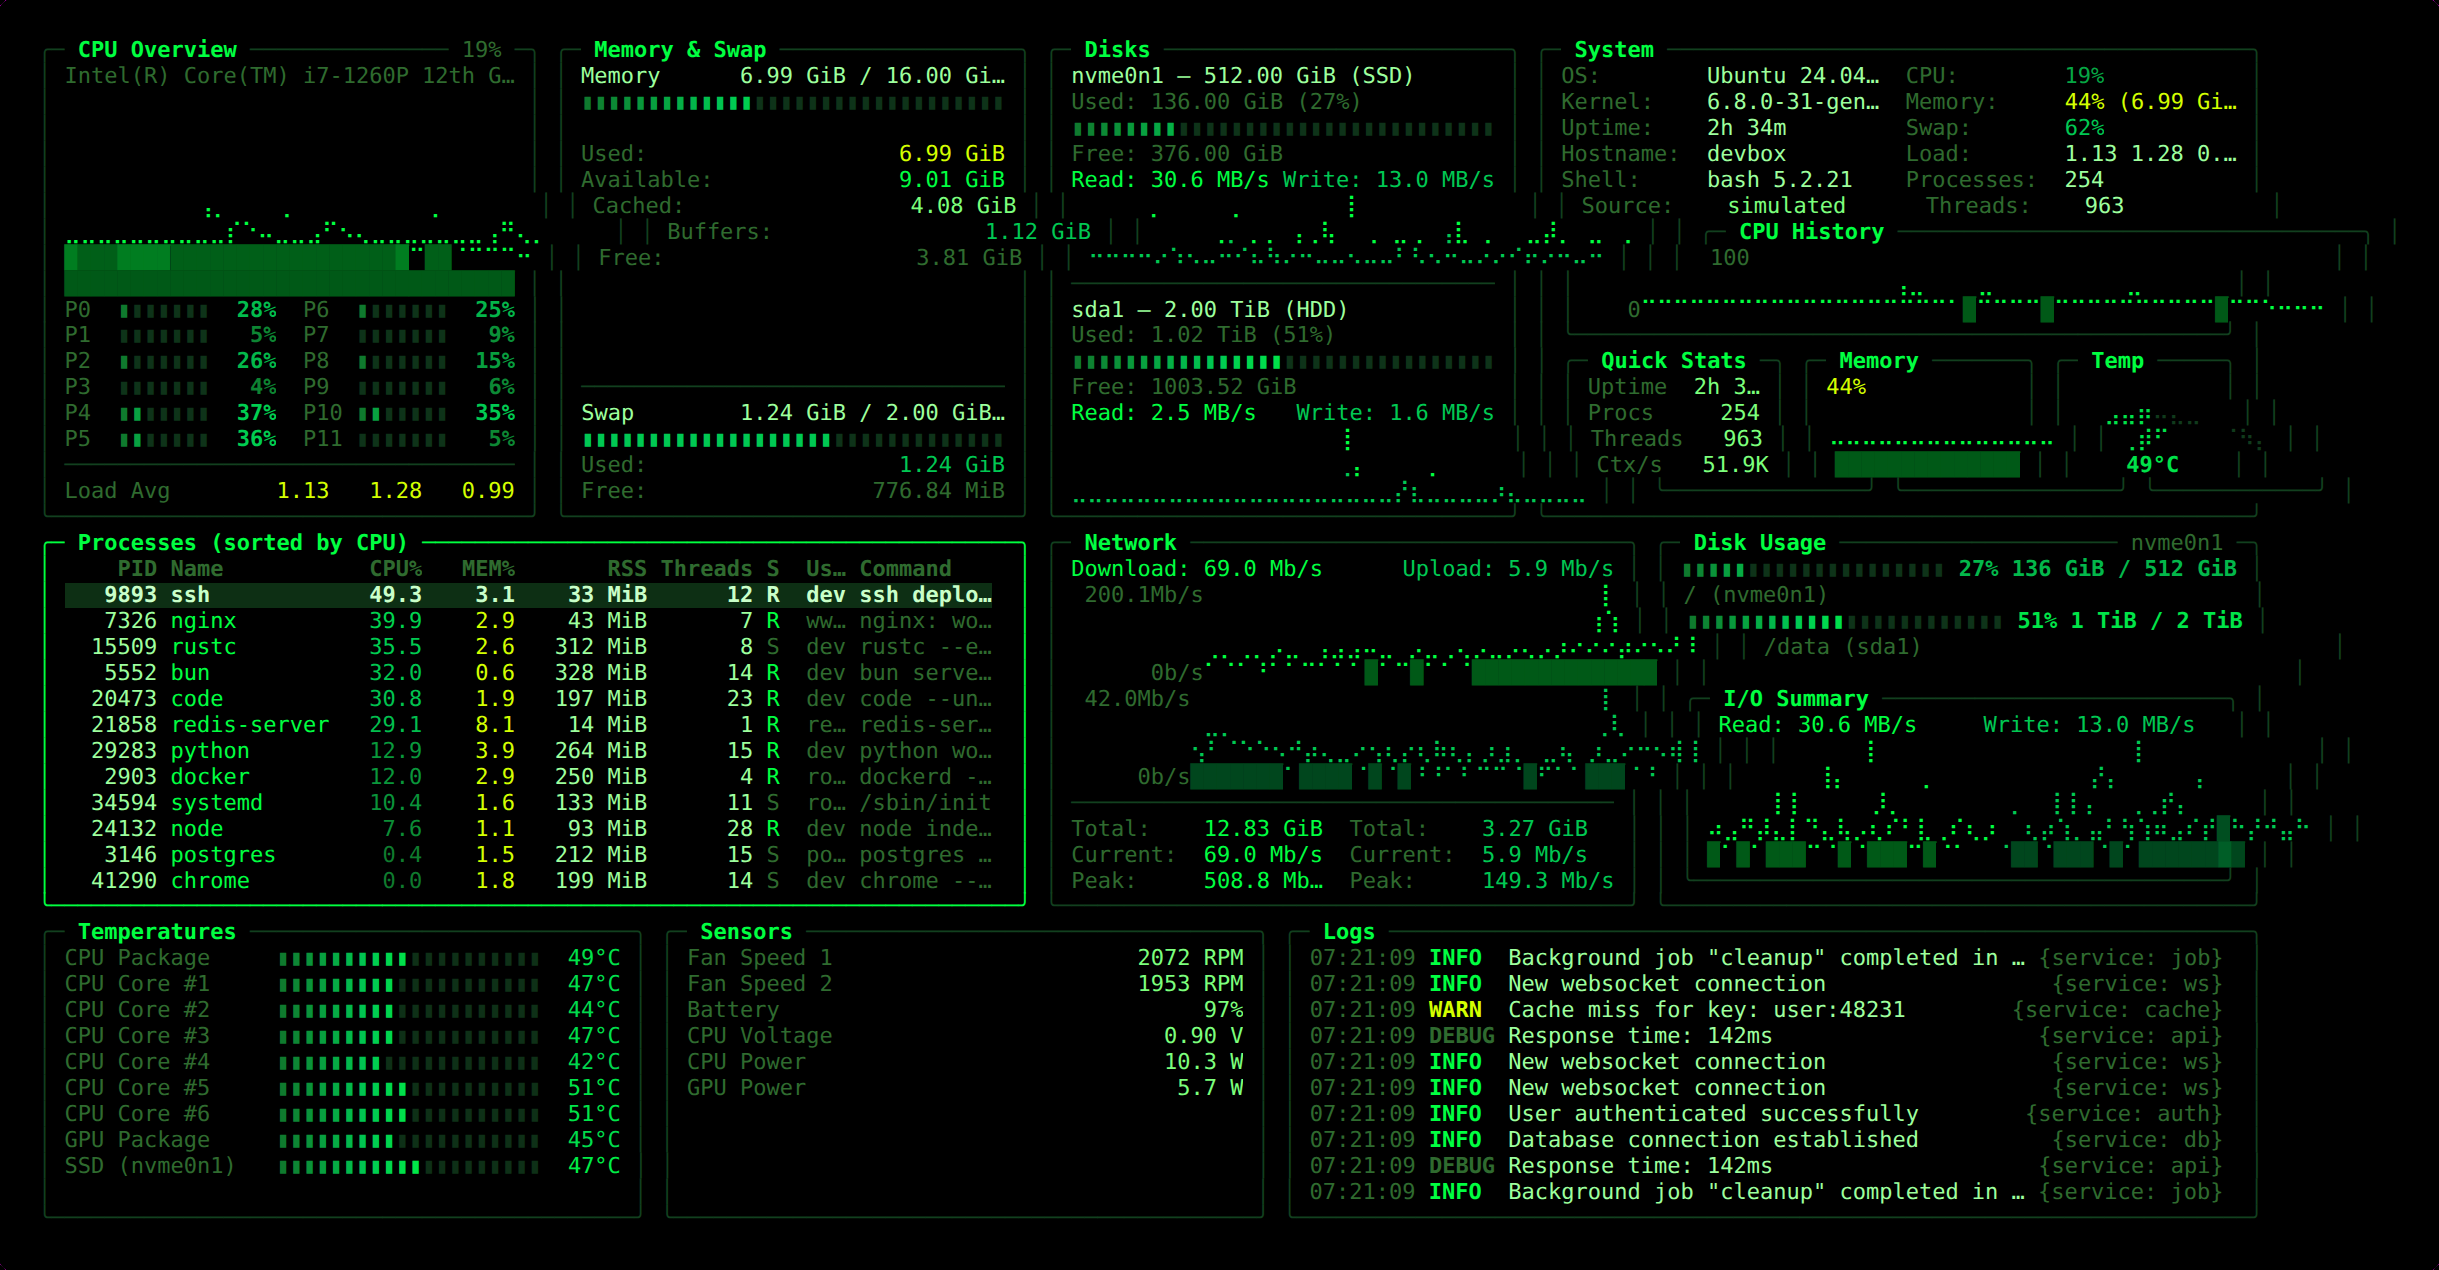
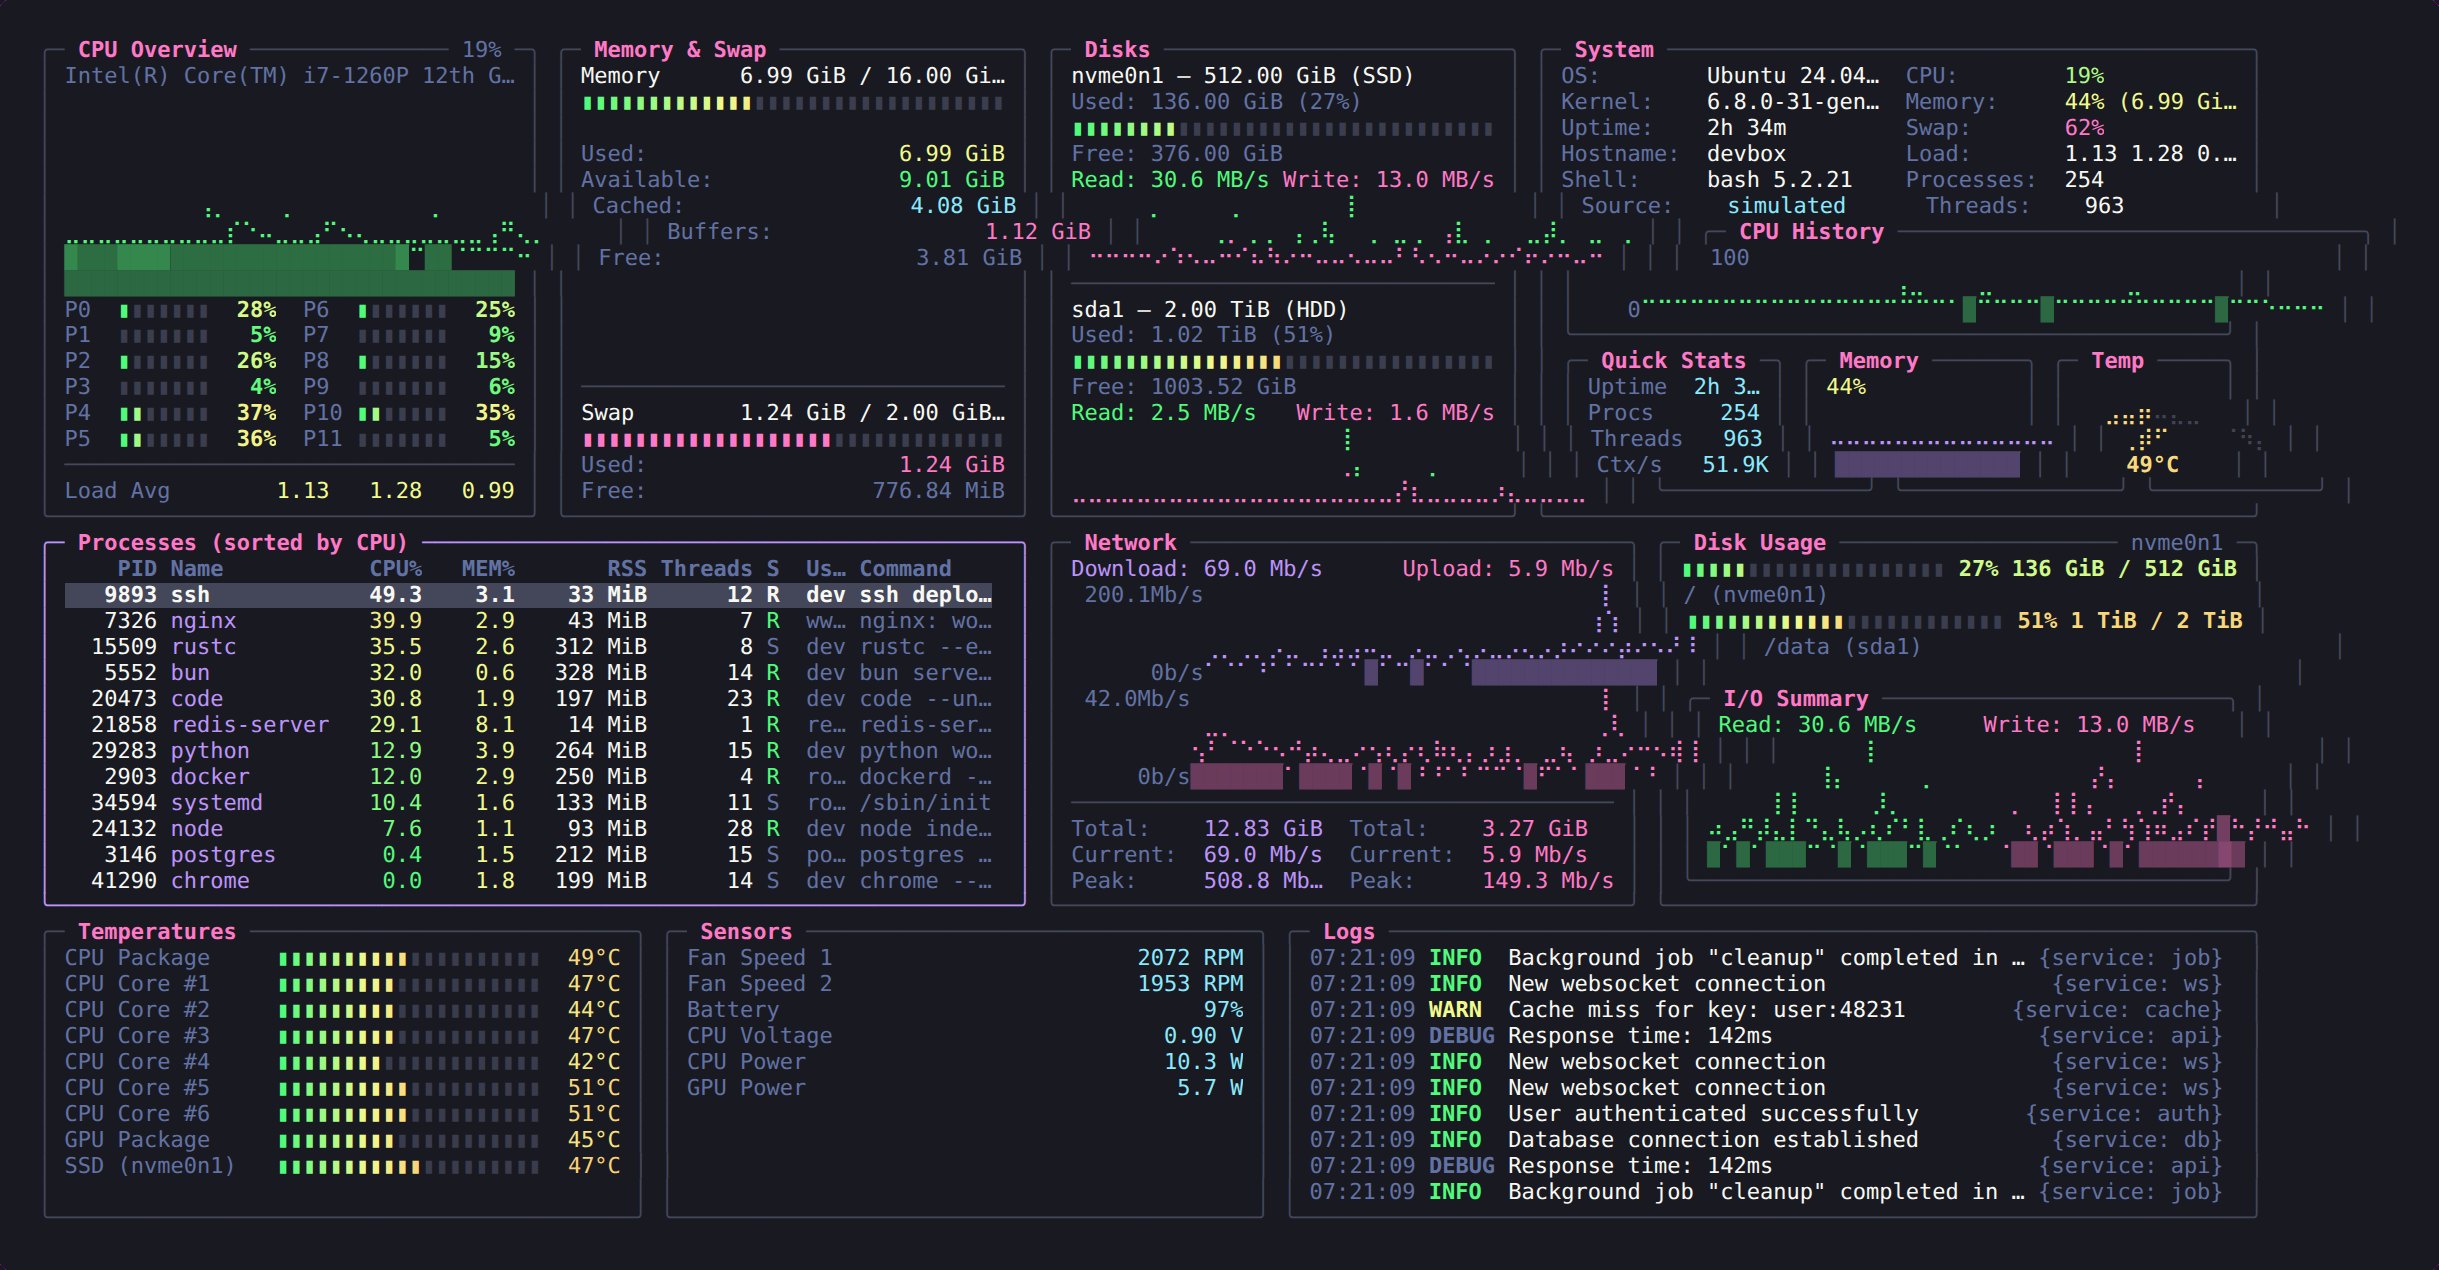
The same panel, four palettes. Colour quantizes automatically when the terminal cannot do truecolor.
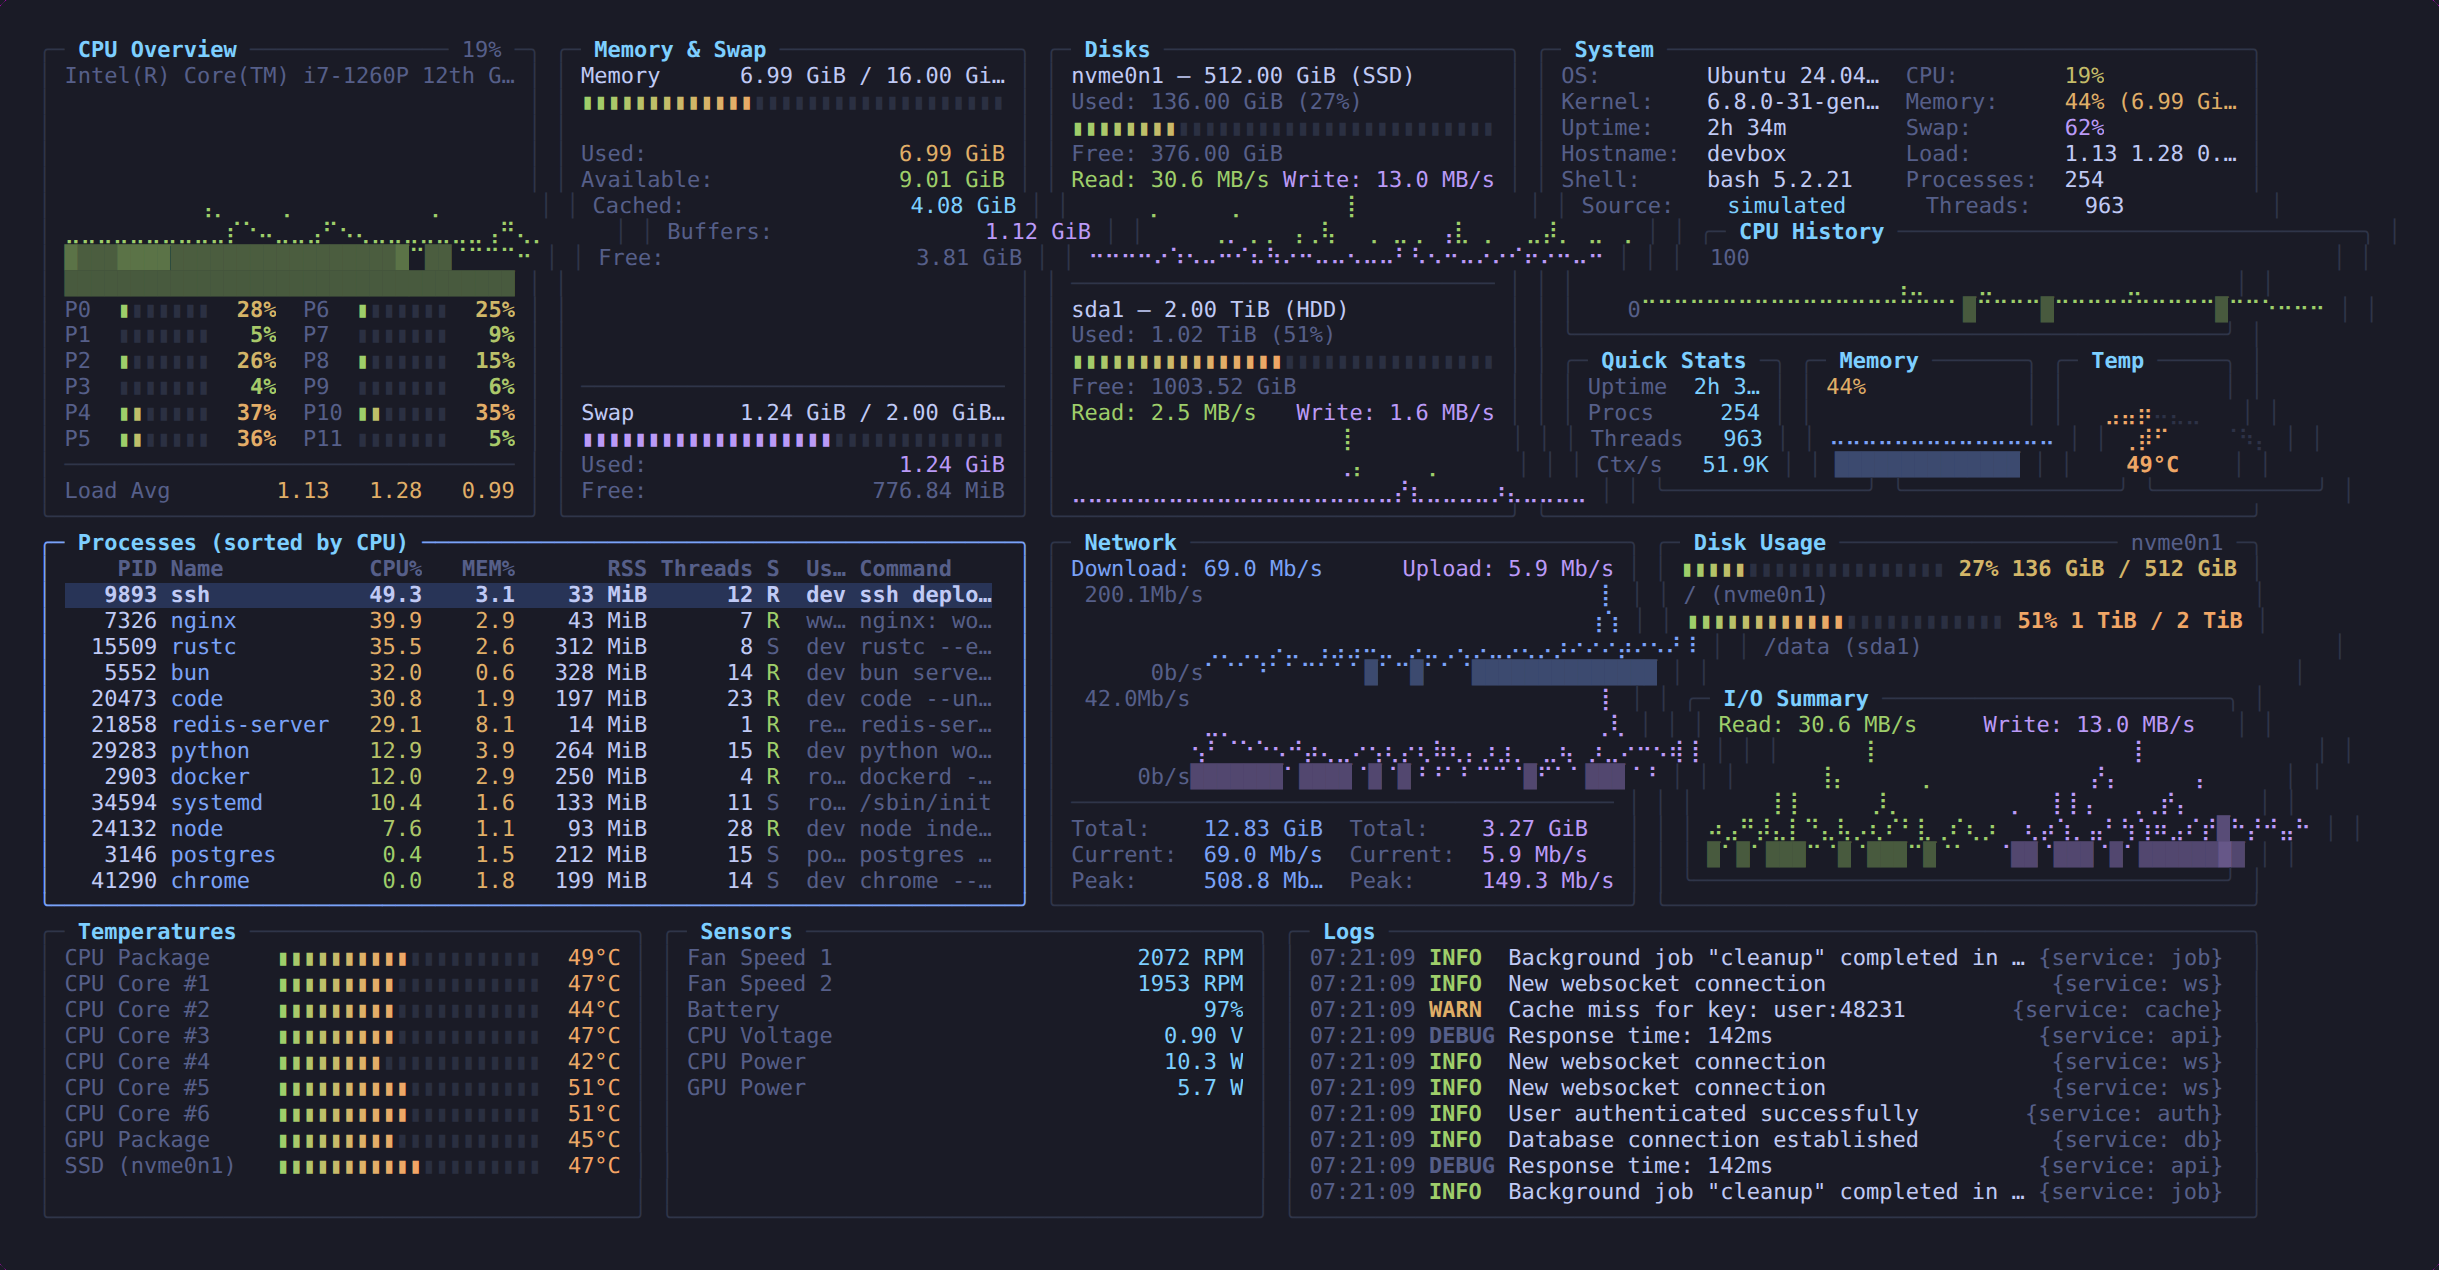
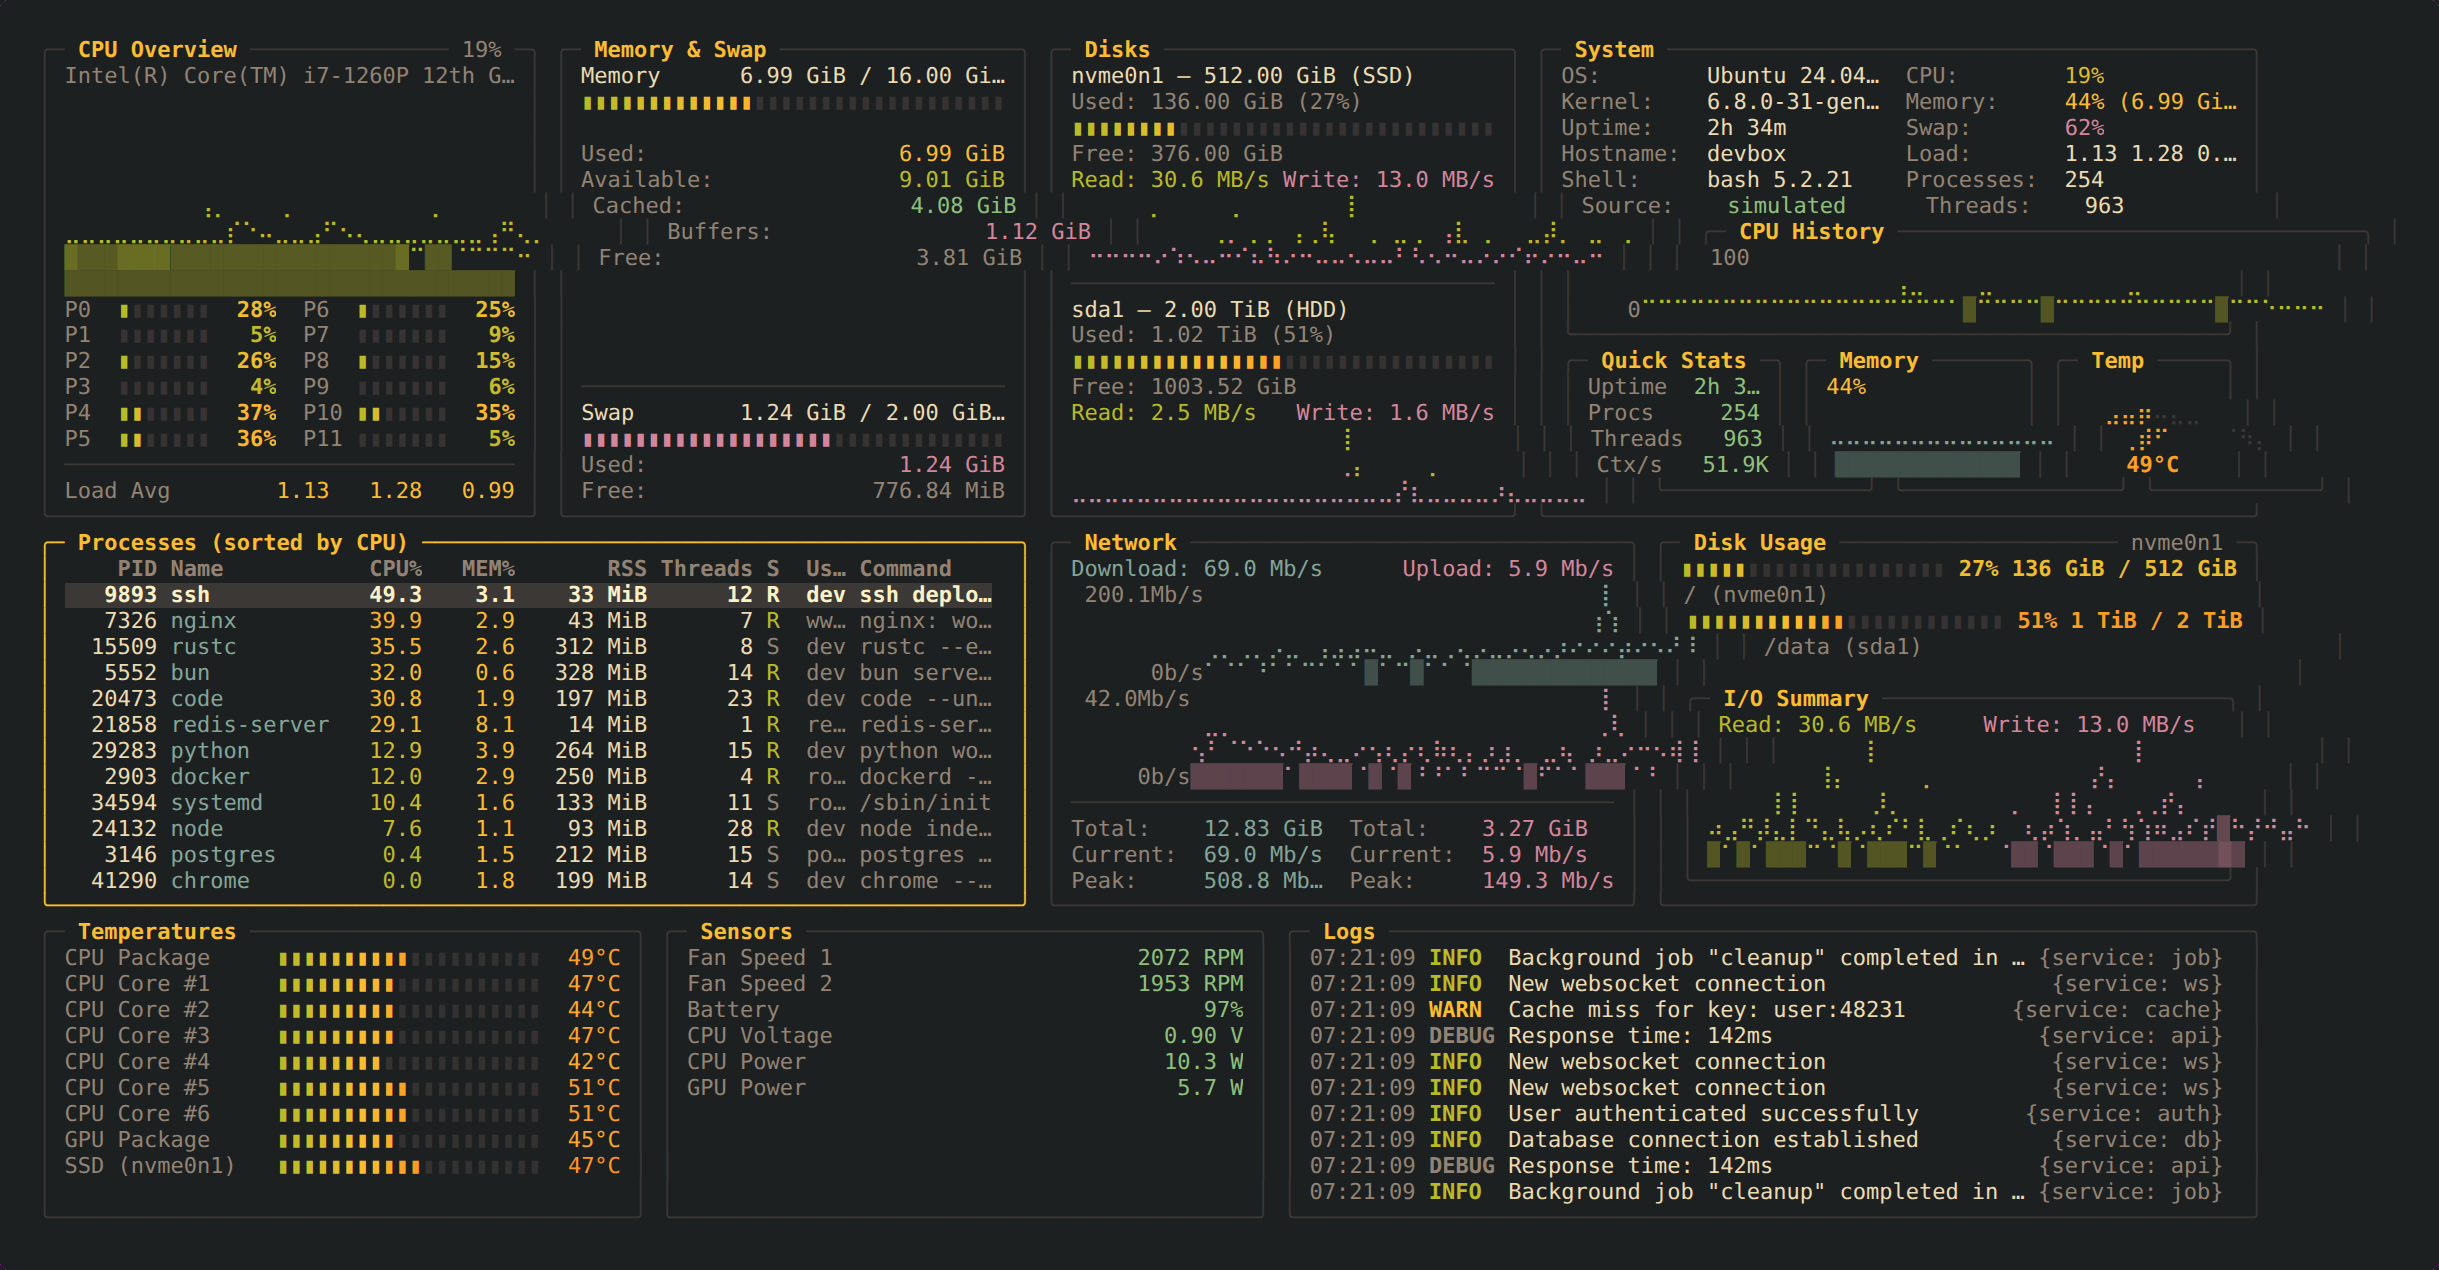
tokyo-night
HQTUI rendered with the tokyo-night theme
gruvbox
HQTUI rendered with the gruvbox theme
matrix
HQTUI rendered with the matrix theme
dracula
HQTUI rendered with the dracula theme

Run it yourself

The reference dashboard reads real metrics on Linux, macOS and Windows, or runs a deterministic simulation.

bunx @profullstack/hqtui-demo
bunx @profullstack/hqtui-demo --sim